Cool Guides
Rules for Posting Guides on Our Community
1. Defining a Guide Guides are comprehensive reference materials, how-tos, or comparison tables. A guide must be well-organized both in content and layout. Information should be easily accessible without unnecessary navigation. Guides can include flowcharts, step-by-step instructions, or visual references that compare different elements side by side.
2. Infographic Guidelines Infographics are permitted if they are educational and informative. They should aim to convey complex information visually and clearly. However, infographics that primarily serve as visual essays without structured guidance will be subject to removal.
3. Grey Area Moderators may use discretion when deciding to remove posts. If in doubt, message us or use downvotes for content you find inappropriate.
4. Source Attribution If you know the original source of a guide, share it in the comments to credit the creators.
5. Diverse Content To keep our community engaging, avoid saturating the feed with similar topics. Excessive posts on a single topic may be moderated to maintain diversity.
6. Verify in Comments Always check the comments for additional insights or corrections. Moderators rely on community expertise for accuracy.
Community Guidelines
-
Direct Image Links Only Only direct links to .png, .jpg, and .jpeg image formats are permitted.
-
Educational Infographics Only Infographics must aim to educate and inform with structured content. Purely narrative or non-informative infographics may be removed.
-
Serious Guides Only Nonserious or comedy-based guides will be removed.
-
No Harmful Content Guides promoting dangerous or harmful activities/materials will be removed. This includes content intended to cause harm to others.
By following these rules, we can maintain a diverse and informative community. If you have any questions or concerns, feel free to reach out to the moderators. Thank you for contributing responsibly!
view the rest of the comments
With 8 billion people alive I refuse to believe there is any statistical difference between days of the year. For example according to this infographic my birthday is one of the most common but the days before and after are not?
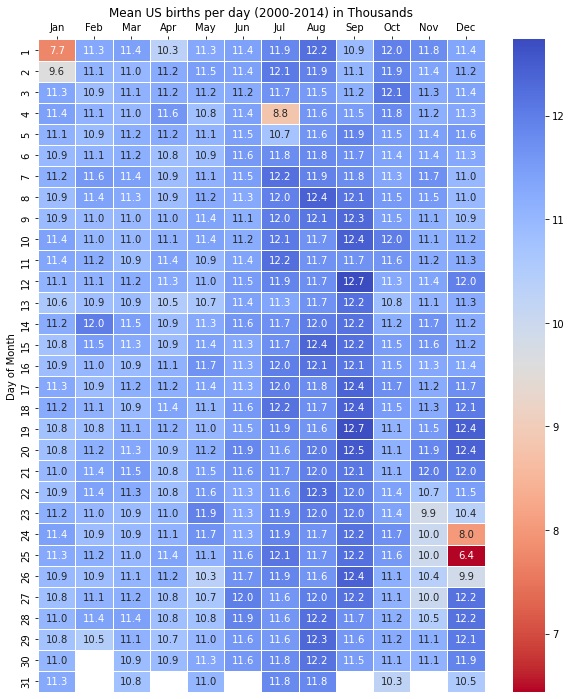
The color scale is terrible. Here is a more credible chart based on presumably the same data by Social Security Administration, covering 62,187,024 US births (2000-2014).
Meanwhile, the post's chart's actual Reddit OOP is u/plotset, an account made to shill PlotSet.com, a data visualization software.
They had this to say about the data:
Note that the "4,153,303" figure is bullshit. It is close to births per year but does not actually correspond to the sum in any of the 15 years, nor the average.
Also, neither chart normalizes by weekday: 3 of the years in question started on Tuesday and Saturday while only 1 on Friday, causing most of the variation that got amplified by OOP's terrible color range. (Because of leap years, I made a table of most common starting weekdays for each month; see my other comment. For example, one of the most common birthdays, August 15, was more often Wednesday or Friday than Saturday.) Without doing weird math, one can ensure the effect of weekdays is largely mitigated by using data from 28 consecutive years, which I believe can be pieced together from several good online sources but I'll be leaving that as an exercise to the reader.
So it is about average for almost all days. You have more births in fall, probably because of more sex in winter.
And it seems women really don't want to birth on important holidays. I didn't think that the power of will is that strong.
Don't forget the weekdays. The total births in the dataset by weekday are:
SUN|||||||||||||||||||||||| 5886889MON||||||||||||||||||||||||||||||||||||| 9316001TUE||||||||||||||||||||||||||||||||||||||||| 10274874WED|||||||||||||||||||||||||||||||||||||||| 10109130THU|||||||||||||||||||||||||||||||||||||||| 10045436FRI||||||||||||||||||||||||||||||||||||||| 9850199SAT|||||||||||||||||||||||||| 6704495It's not, but the power of scheduling a c-section so that you don't spend Christmas at the hospital is.