1

Be respectful


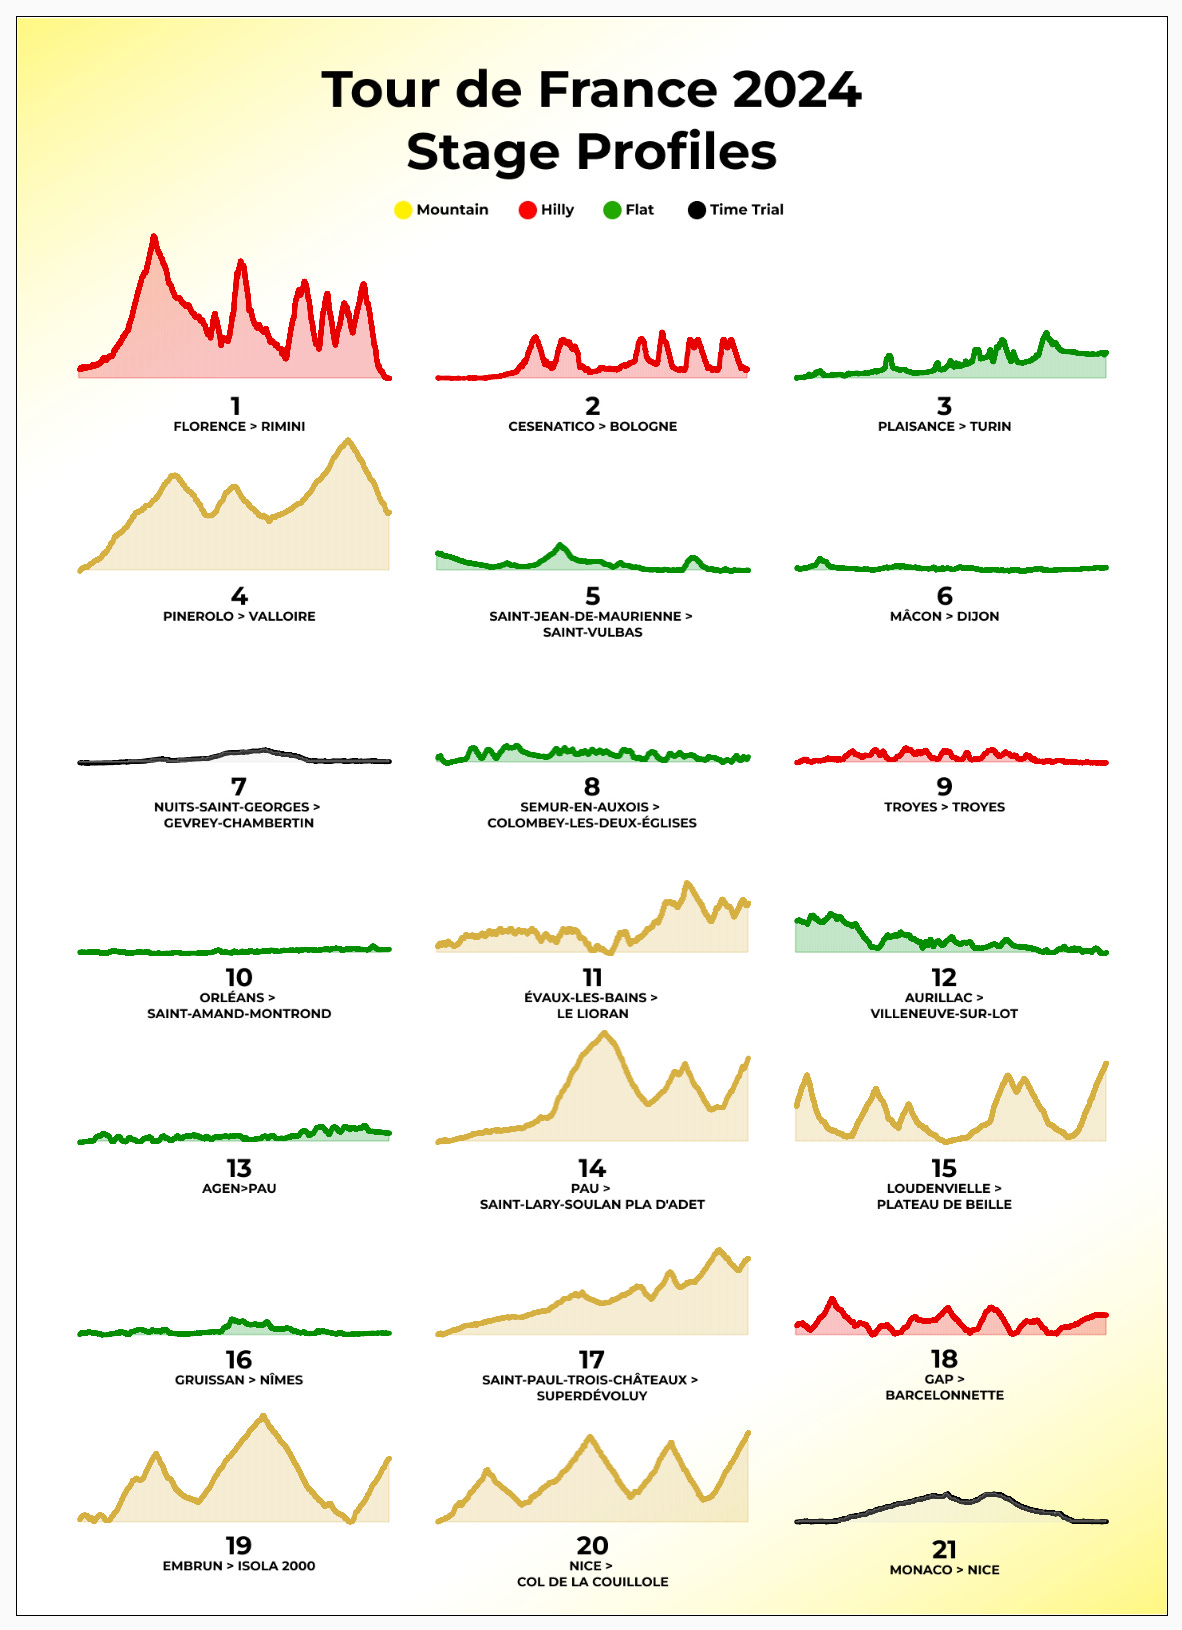
Source:https://stevenmarcscott.substack.com/p/tour-de-france-2024-stage-profiles?r=3qls9
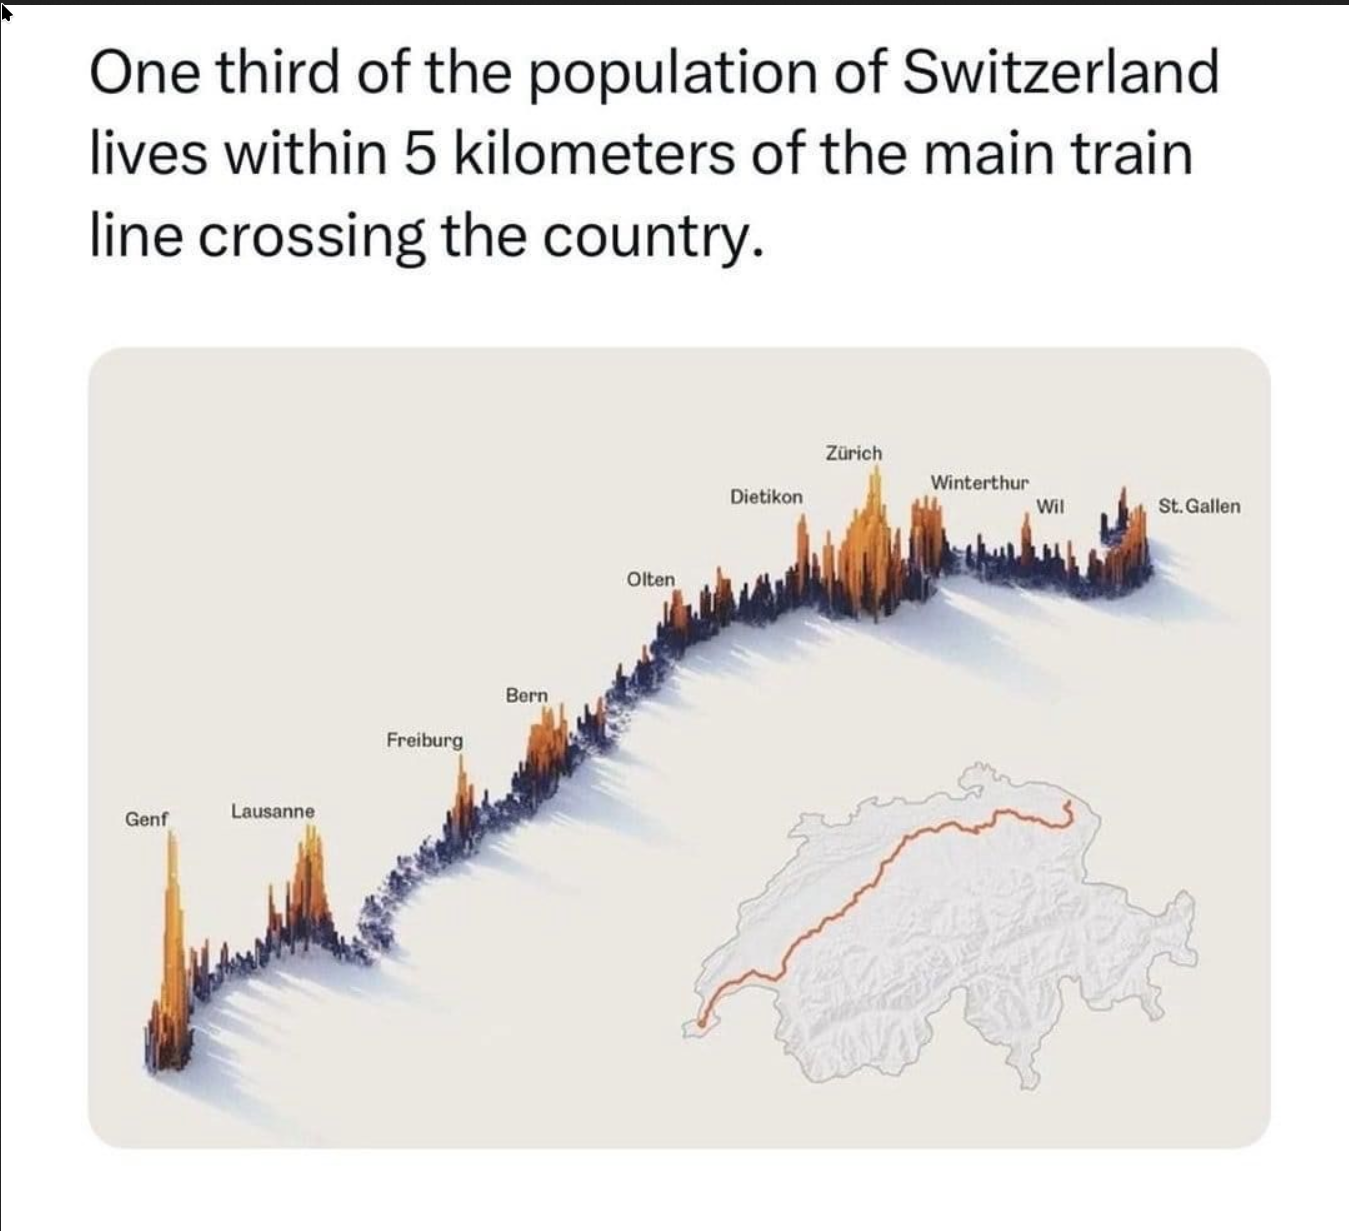
Source (yes sorry it's LinkedIn, if you any another one, I'll update): https://www.linkedin.com/posts/prof-stefan-michel_notsweden-train-activity-7210174690827370496-8iJz?utm_source=share&utm_medium=member_ios

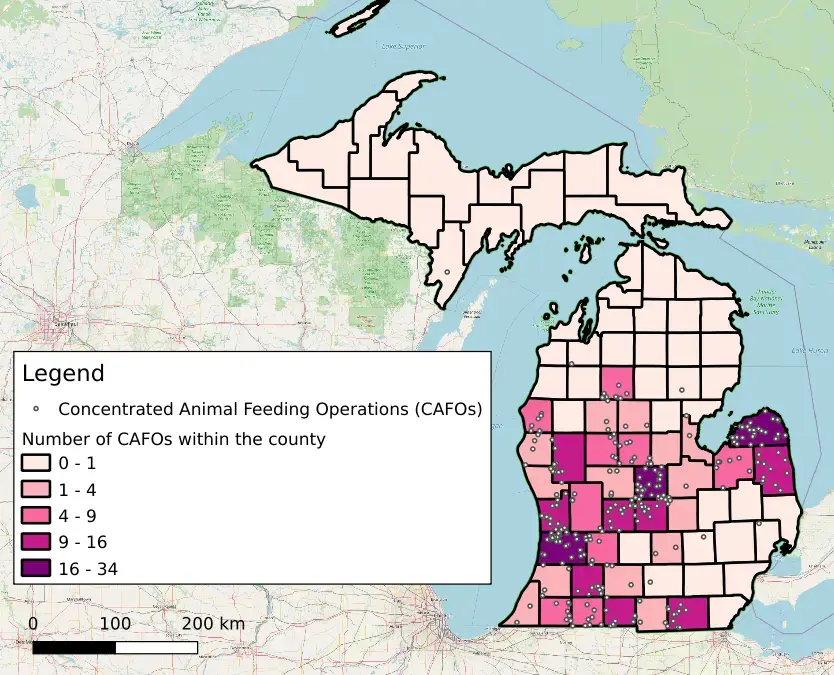
Source of data: https://dataverse.harvard.edu/dataset.xhtml?persistentId=doi:10.7910/DVN/T0HSJ1
Edit: removed OC as it's not (sorry)

Data from:
Map created using QGIS, a free and open source geographic information system.
Color blind friendly color palette selected using ColorBrewer 2.0.
Source: https://www.douane.gouv.fr/la-douane/opendata/mots-cles/recolte
Be careful, numbers are department numbers, not quantity of wine (which is represented by the color)

I sourced the data from dozens of 90s hip hop songs. Then used Python to analyze that file, and D3 to visualize the information. Here is a GitHub repo with the code I used. And here is a YouTube video exploring that code and how it all works together.
I'm not the original author. But I thought it was cool and thought it should live on Lemmy.


