bahmanm

joined 1 year ago
 

cross-posted from: https://lemmy.ml/post/5719058

Follow up on a previous post: [DISCUSS] Recent momentary outages


I've been working on a simple opt-in solution, primarily for Lemmy end users like me (but also helpful for admins), to easily check the status/health of their favourite instance.

๐ŸŒŽ lemmy-meter.info

You can find the details of the implementation in lemmy-meter github repo.


โ“ @admins: would you be interested in adding your instance to lemmy-meter?

You don't need to do anything except confirming - I'll handle the rest. It should only take a few minutes for your instance to show up in lemmy-meter.

Out of the box it will send only 4 HTTP GET requests per minute to your instance. However that is totally configurable if it sounds too much or too little.


PS: I wasn't sure how to reach out to the admins short of messaging them individually.


cross-posted from: https://lemmy.ml/post/5653264

I'm using Grafana for one of my hobby projects which is also deployed to a public-facing server.

I am the only user of Grafana as it is supposed to be read-only for anonymous access.

My current workflow is:

  1. Run Grafana locally.
  2. Make changes to local dashboards, data-sources, ...
  3. Stop local Grafana.
  4. Stop remote Grafana.
  5. Copy local grafana.db to the remote machine.
  6. Start remote Grafana.
  7. Goto (1)

However this feels terribly inefficient and stupid to my mind ๐Ÿ˜…


To automate parts of this process, I tried gdg and grafana-backup-tool.

I couldn't get the former to work w/ my workflow (local storage) as it barfed at the very start w/ the infamous "invalid cross-device link" Go error.

The latter seems to work but only partially; for example organisations are not exported.


โ“ Given I may switch to PostgreSQL as Grafana's DB in the near future, my question is, what is the best way to automate my process short of stopping Grafana and copying database files.


TLDR; The author argues that free-form logging is quite useless/expensive to use. They also argue that structured logging is less effective than tracing b/c of mainly the difficulty of inferring timelines and causality.


I find the arguments very plausible.

In fact I very rarely use logs produced by several services b/c most of the times they just confuse me. The only time that I heavily use logs is troubleshooting a single service and looking at its stdout (or kubectl log.)

However I have very little experience w/ tracing (I've used it in my hobby projects but, obviously, they never represent the reality of complex distributed systems.)

Have you got real world experience w/ tracing in larger systems? Care to share your take on the topic?

1
submitted 11 months ago* (last edited 11 months ago) by bahmanm@lemmy.ml to c/devops@lemmy.ml
 

A few days DHH (from 37signals) wrote about how they moved off the cloud and how that has helped reduce their costs by a good measure.

Well, earlier today, he announced the first bit of tooling that they used as part of their cloud exit move: Kamal - which is already at version 1.0 and, according to DHH, stable.


I took a quick look at the documentation and it looks to me like an augmented and feature-rich Docker Compose which is, to no surprise, rather opinionated.

I think anyone who's had experience with the simplicity of Docker Swarm compared to K8s would appreciate Kamal's way. Hopefully it will turn out to be more reliable than Swarm though.

I found it quite a pragmatic approach to containerising an application suite with the aim of covering a good portion of a the use-cases and requriements of smaller teams.


PS: I may actually try it out in an ongoing personal project instead of Compose or K8s. If I do, I'll make sure to keep this post, well, posted.

1
submitted 1 year ago* (last edited 11 months ago) by bahmanm@lemmy.ml to c/devops@lemmy.ml
 

Update

Turned out I didn't need to convert any series to gauges at all!

The problem was that I had botched my Prometheus configuration and it wasn't ingesting the probe results properly ๐Ÿคฆโ€โ™‚๏ธ Once I fixed that, I got all the details I needed.

For posterity you can view lemmy-meter's configuration on github.


cross-posted from: https://lemmy.ml/post/5114491

I'm using blackbox_exporter to monitor a dozen of websites' performance. And that is working just fine for measuring RTT and error rates.

I'm thinking about creating a single gauge for each website indicating whether it is up or down.


I haven't been able to find any convincing resource as to if it is mathematically correct to convert such series to guages/counters - let alone how to do that.

So my questions are

  • Have I missed a relevant option in blackbox_exporter configurations?
  • Do you recommend converting series to gauges/counters? If yes, can you point me to a resources so that I can educate myself on how to do it?

PS: To my surprise, there were no communities around Observability in general and Prometheus in particular. So I went ahead and created one: !observability@lemmy.ml


To be fair, here's the complete paragraph which makes sense:

Vagrant public networks are less private than private networks, and the exact meaning actually varies from provider to provider, hence the ambiguous definition. The idea is that while private networks should never allow the general public access to your machine, public networks can.


cross-posted from: https://lemmy.ml/post/4593804

Originally discussed on Matrix.


TLDR; Ansible handlers are added to the global namespace.


Suppose you've got a role which defines a handler MyHandler:

- name: MyHandler
  ...
  listen: "some-topic"

Each time you import/include your role, a new reference to MyHandler is added to the global namespace.

As a result, when you notify your handler via the topics it listens to (ie notify: "some-topic"), all the references to MyHandler will be executed by Ansible.

If that's not what you want, you should notify the handler by name (ie notify: MyHandler) in which case Ansible will stop searching for other references as soon as it finds the first occurrence of MyHandler. That means MyHandler will be executed only once.

1
submitted 1 year ago* (last edited 1 year ago) by bahmanm@lemmy.ml to c/lisp@lemmy.ml
 

cross-posted from: https://lemmy.ml/post/4591838

Suppose I need to find out if the intersection of an arbitrary number of lists or sequences is empty.

Instead of the obvious O(n^2^) approach I used a hash table to achieve an O(n) implementation.

Now, loop mini-language aside, is this idiomatic elisp code? Could it be improved w/o adding a lot of complexity?

You can view the same snippet w/ syntax highlighting on pastebin.

(defun seq-intersect-p (seq1 seq2 &rest sequences)
 "Determine if the intersection of SEQ1, SEQ2 and SEQUENCES is non-nil."
 (cl-do* ((sequences `(,seq1 ,seq2 ,@sequences) (cdr sequences))
          (seq (car sequences) (car sequences))
          (elements (make-hash-table :test #'equal))
          (intersect-p nil))
     ((or (seq-empty-p sequences)) intersect-p)
   (cl-do* ((seq seq (cdr seq))
            (element (car seq) (car seq)))
       ((or intersect-p (seq-empty-p seq)) intersect-p)
     (if (ht-get elements element)
         (setf intersect-p t)
       (ht-set elements element t)))))

(defun test-seq-intersect-p ()
 "Test cases."
 (cl-assert (null (seq-intersect-p '()
                                   '())))
 (cl-assert (null (seq-intersect-p '(1)
                                   '())))
 (cl-assert (null (seq-intersect-p '(1 2)
                                   '(3 4)
                                   '(5 6))))
 (cl-assert (seq-intersect-p '(1 2)
                             '(3 4)
                             '(5 6)
                             '(1)))
 t)

(test-seq-intersect-p)

Version 2

(defun seq-intersect-p (first second & sequences)
  "Determine if FIRST, SECOND and any of the sequences in SEQUENCES have
an intersection."
  (if (seq-empty-p sequences)
      (seq-intersection first second)
    (or (seq-intersection first second)
        (apply #'seq-intersect-p
               first
               (seq-first sequences)
               `,@(seq-rest sequences))
        (apply #'seq-intersect-p
               second
               (seq-first sequences)
               `,@(seq-rest sequences))
        (apply #'seq-intersect-p
               (seq-first sequences)
               (seq-elt sequences 2)
               `,@(seq-rest (seq-rest sequences))))))
 

I am not the author.

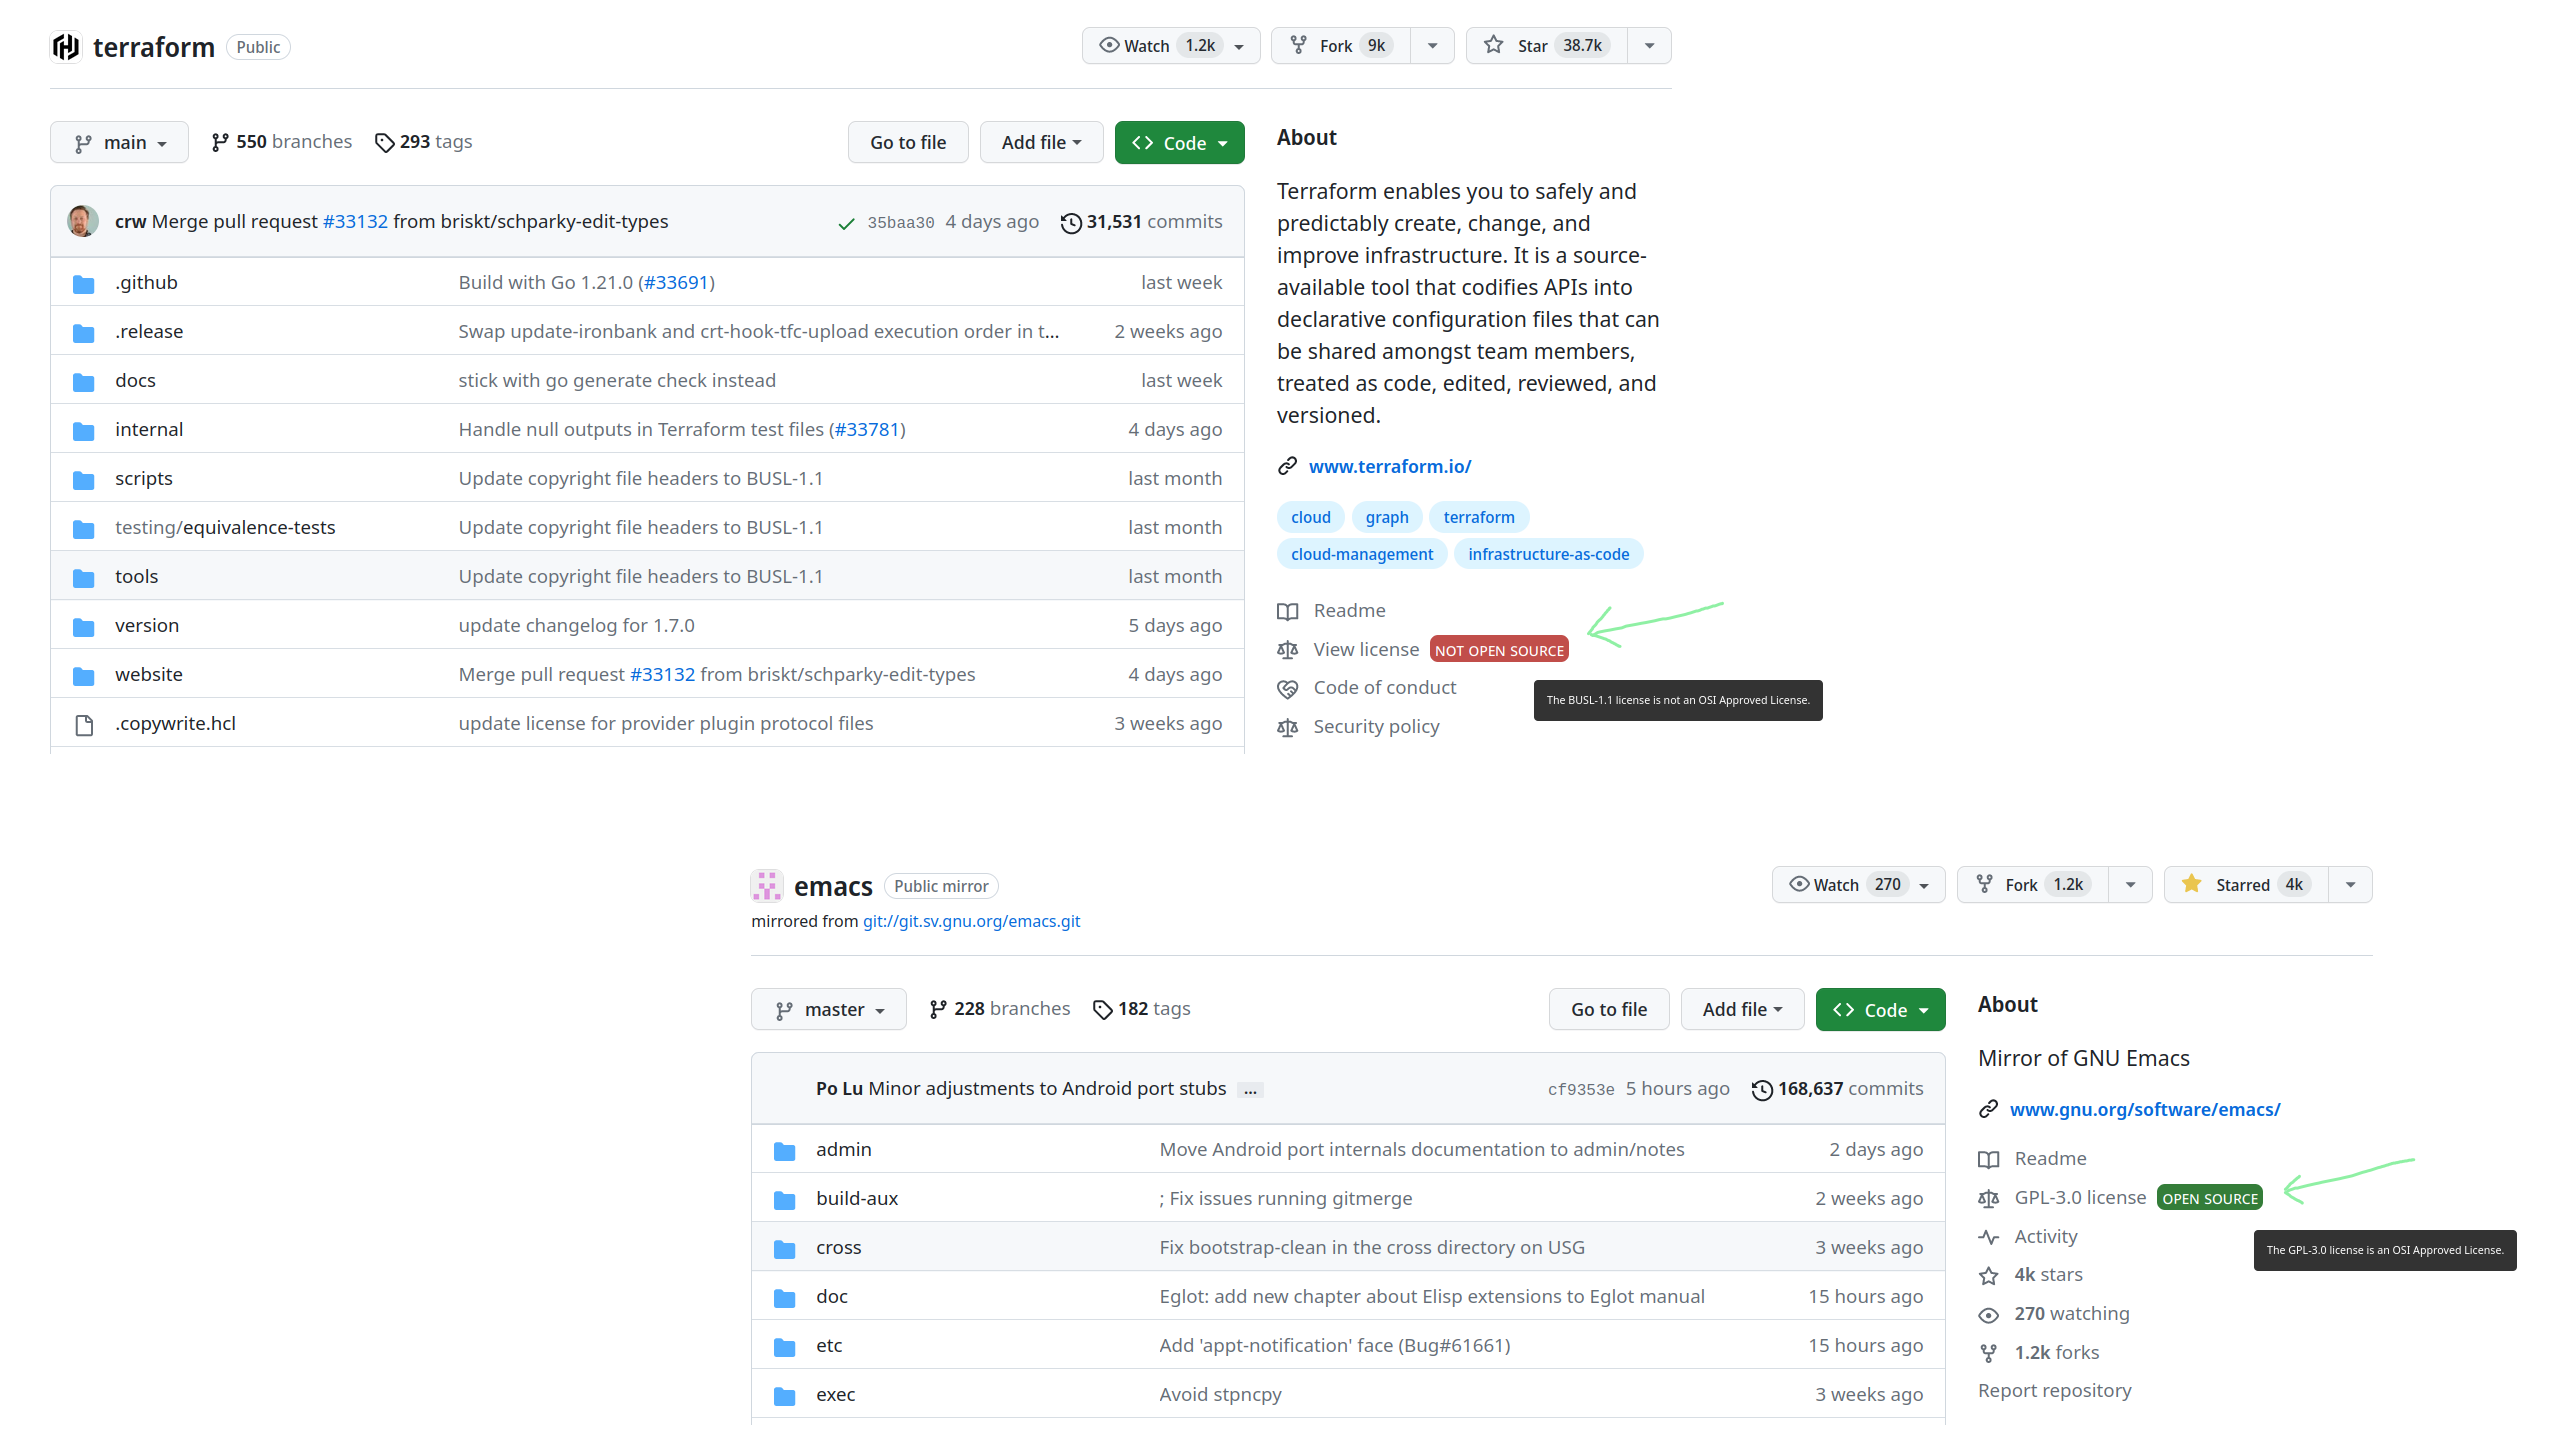
https://github.com/galdor/github-license-observer

https://addons.mozilla.org/en-GB/android/addon/github-license-observer/

This is a cool little addon to help you tell, at a glance, if the repository you're browsing on github has an open source license license.

Especially relevant nowadays given the trend to convert previously OS repos to non-OS licenses as a business model (eg Akka or Terraform.)

view more: โ€น prev next โ€บ