Nothing. I always use the standard configuration from the services I've installed. If something doesn't work I go into those logs and look what's wrong.
this post was submitted on 29 Jul 2023
0 points (NaN% liked)
Linux
46778 readers
1306 users here now
From Wikipedia, the free encyclopedia
Linux is a family of open source Unix-like operating systems based on the Linux kernel, an operating system kernel first released on September 17, 1991 by Linus Torvalds. Linux is typically packaged in a Linux distribution (or distro for short).
Distributions include the Linux kernel and supporting system software and libraries, many of which are provided by the GNU Project. Many Linux distributions use the word "Linux" in their name, but the Free Software Foundation uses the name GNU/Linux to emphasize the importance of GNU software, causing some controversy.
Rules
- Posts must be relevant to operating systems running the Linux kernel. GNU/Linux or otherwise.
- No misinformation
- No NSFW content
- No hate speech, bigotry, etc
Related Communities
Community icon by Alpár-Etele Méder, licensed under CC BY 3.0
founded 5 years ago
MODERATORS
I've just started digging into it myself ! Here's my current setup (I'll see how it scales in the long term):
- syslog on every host
- Telegraf collects and parse logs
- InfluxDB stores everything
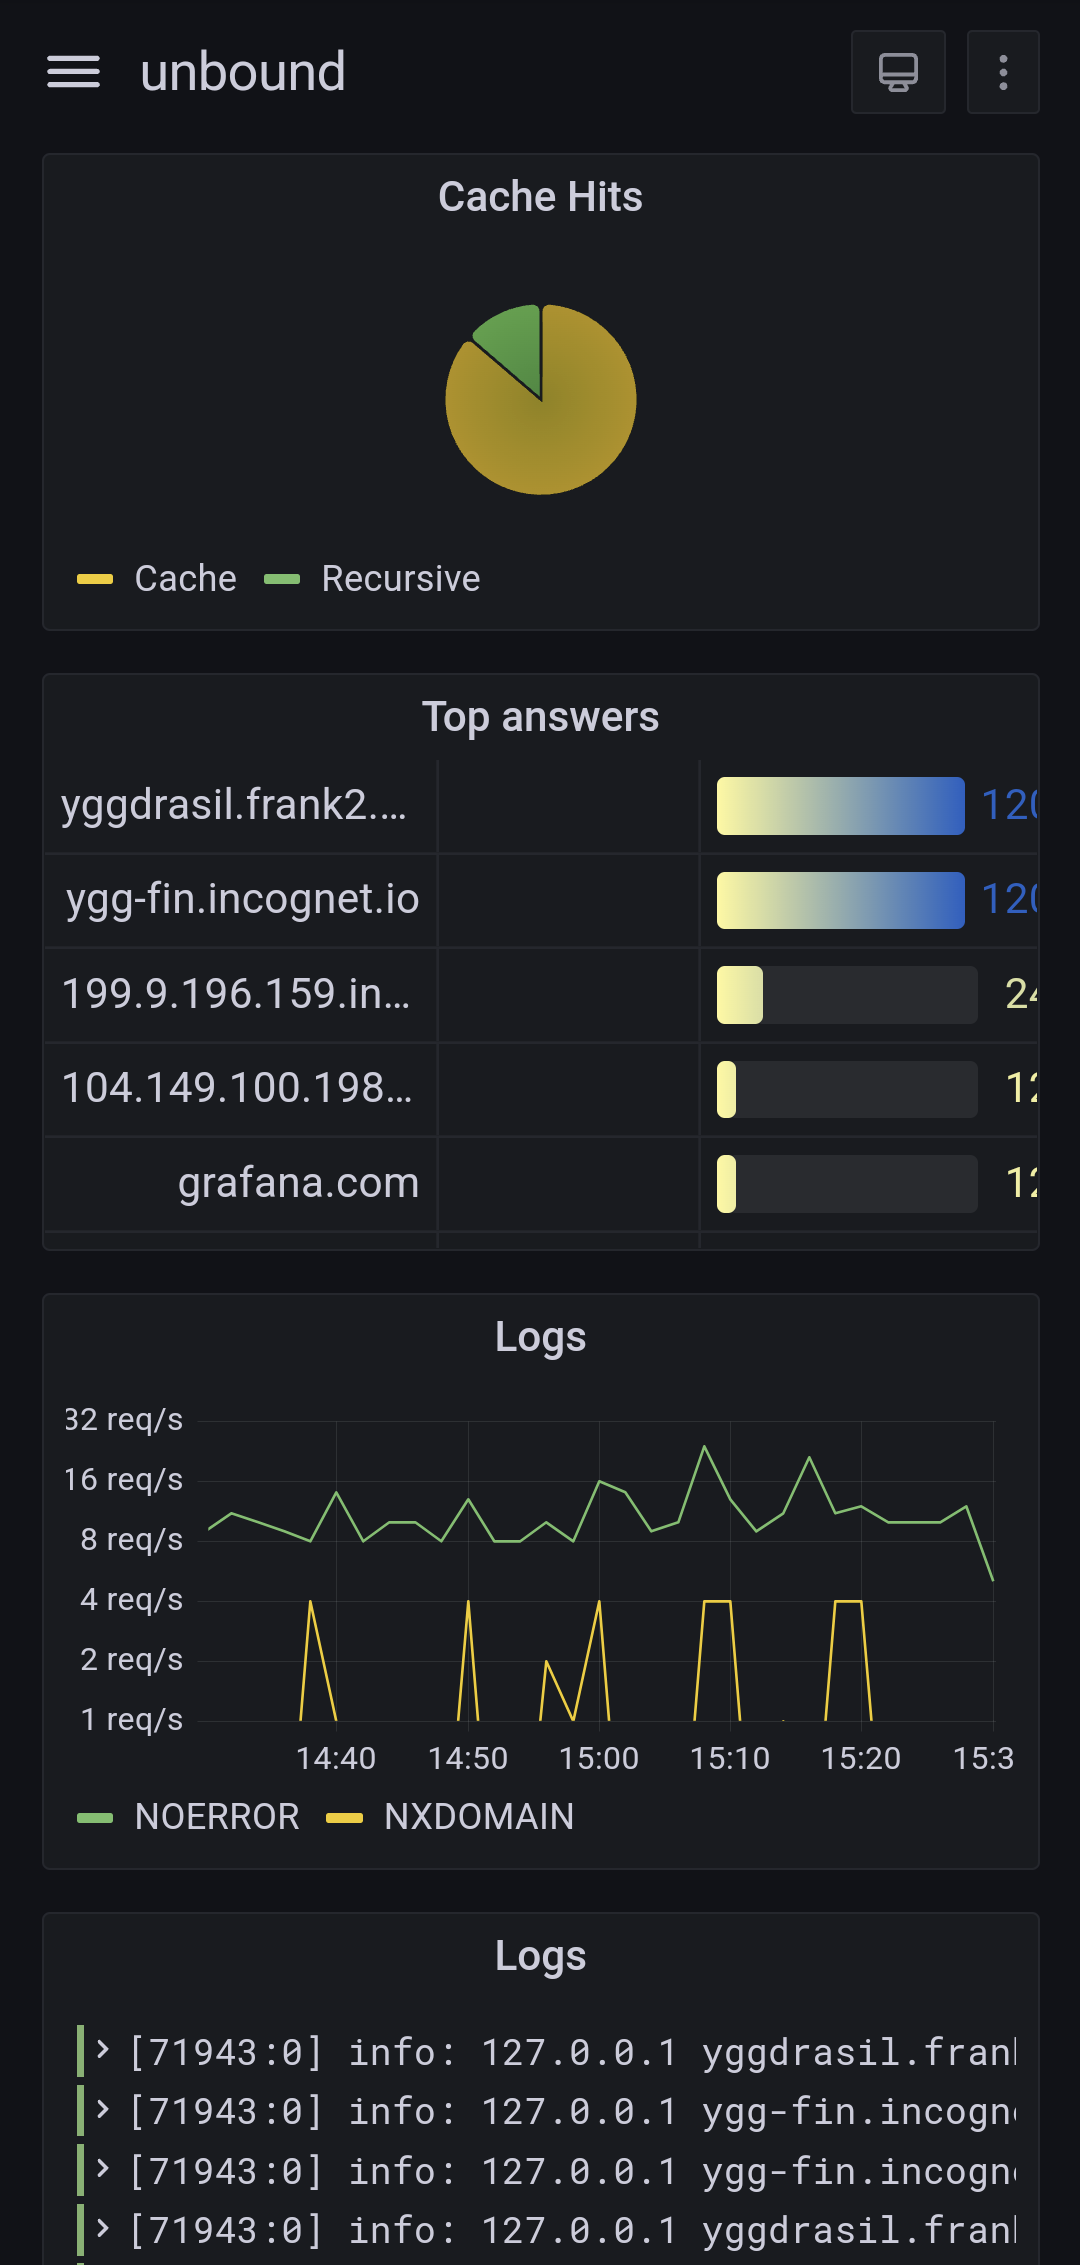
- Grafana for dashboards
I run OpenBSD on all my servers, and configure all the services to log via syslog.
Then I configuré syslog to send only those I care about (https, DNS, ...) to a central telegraf instance, using the syslog protocol (RFC3164).
On this collector, telegraf gets all these logs and parse them using custom grok patterns I'm currently building, to make sense out of every log line it receives. The parsed logs are in turns stored in Influxdb, running on the same host.
I then use Grafana to query InfluxDB and create dashboards out of these logs. Grafana can also display the logs "as-is" so you can search through them (it's not ideal though as you simply search by regex from the full message, so it's on par with grep at least).
This setup is fairly new and seem to work very well. Telegraf is also very low on resource usage for now. I'll have to continue adding grok patterns and send more application logs to it to see how it handles the load. I do have a few questions still unanswered for now, but time will tell:
Q: Should I first collect via a central syslog before sending to telegraf ?
This would let syslog archive all logs in plain text, rotate and compress them. I would also only have a single host to configure for sending logs to telegraf. However this would eat up space, and could hide the original sending hostname for each log. I might try that someday.
Q: Should I run telegraf on each host ?
This would distribute the load of the grok parsing amongst all hosts, and then all telegraf processes will send directly to the central one for collection, or even directly into influxdb. I would also benefit from telegraf being install on each host to collect more data (CPU, network stats, ...). However it makes the configuration more complex to handle.
Q: What is a good retention period ?
For now, influxDB doesn't expire any data, as I don't have much yet. In the long run, I should probably delete old data, but it's hard to tell what is "old" in my case.
Q: Do I need an interface to read logs ?
I use this setup mostly for graphs, as grafana can make sense of fields like "http_verb", "http_code" and such. However, it is much more practical for me to dig into the logs right on the server, in /var/log. Having an interface like chronograf or graylog seems practical, but I feel like it's overdoing it.
Bonus:
How is the query performance of influxdb for searches in logs for text keywords?
Instead of Influxdb we are using Solr and it is pretty much instantaneous for searching and ordering no matter how large the data is (couple of hundred gigabytes of logs for now). We use it to provide true real-time search in logs for our support team.
In terms if logging: sys journal does the job for me ...
I do run prometheus + grafana for some services but that is mostly for some fancy looking graphics nothing really usefull.
I would recomend you to monitor updates of you apps so you are well informed when und what to update (i just have subsribed to all the diffrent release git rss feeds)