492
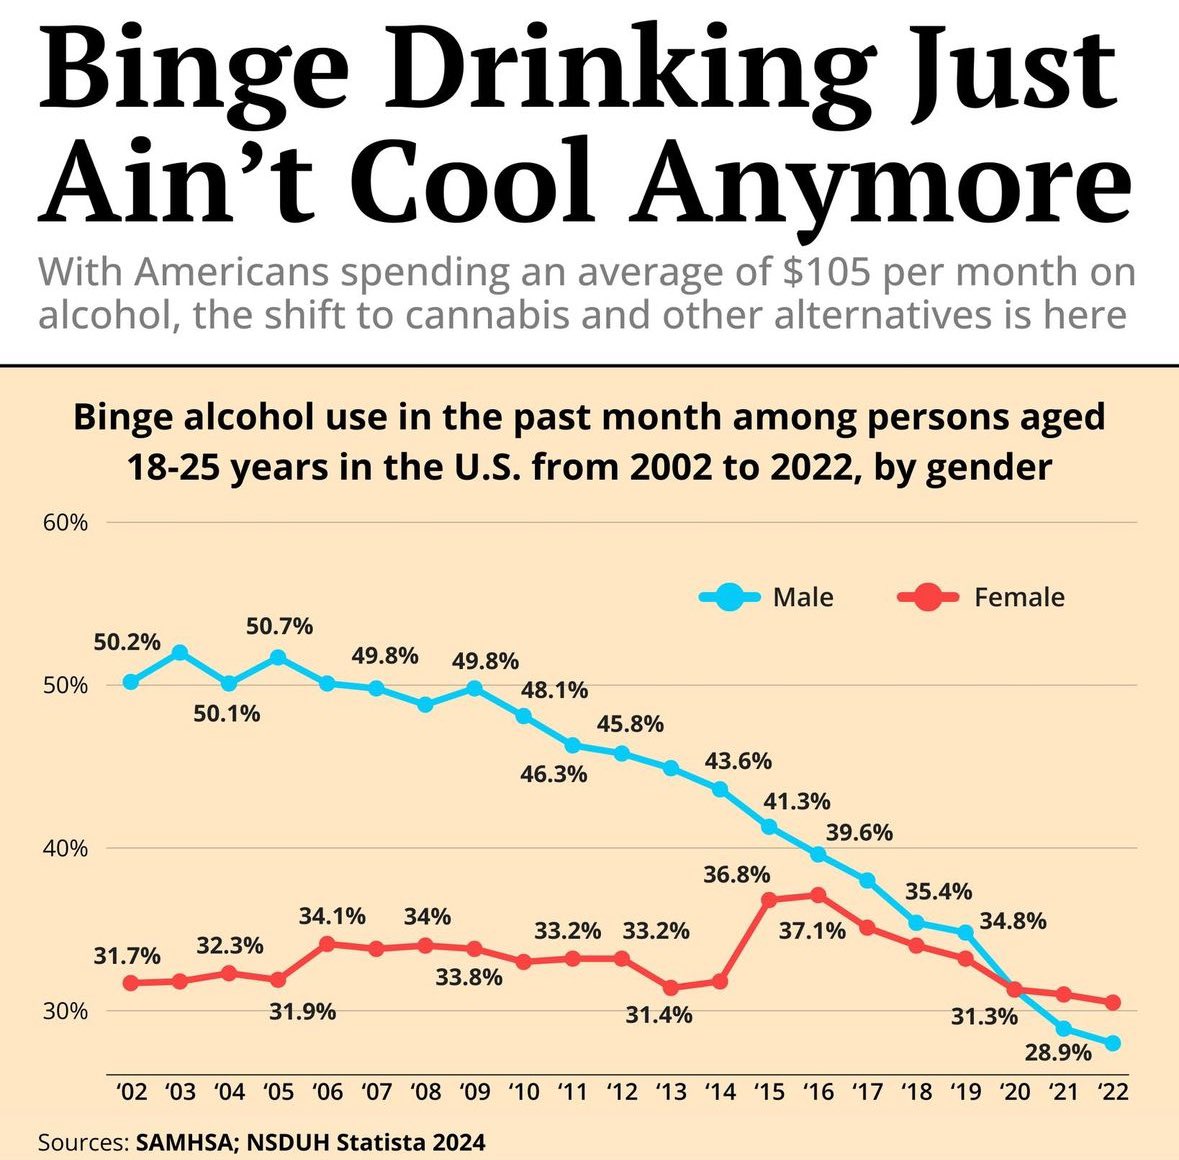
Binge alcohol use in the past month among persons aged 18-25 years in the U.S. from 2002 to 2022, by gender
(lemmy.world)
A place to share and discuss visual representations of data: Graphs, charts, maps, etc.
DataIsBeautiful is for visualizations that effectively convey information. Aesthetics are an important part of information visualization, but pretty pictures are not the sole aim of this subreddit.
A place to share and discuss visual representations of data: Graphs, charts, maps, etc.
  A post must be (or contain) a qualifying data visualization.

  Directly link to the original source article of the visualization
    Original source article doesn't mean the original source image. Link to the full page of the source article as a link-type submission.
    If you made the visualization yourself, tag it as [OC]

  [OC] posts must state the data source(s) and tool(s) used in the first top-level comment on their submission.

  DO NOT claim "[OC]" for diagrams that are not yours.

  All diagrams must have at least one computer generated element.

  No reposts of popular posts within 1 month.

  Post titles must describe the data plainly without using sensationalized headlines. Clickbait posts will be removed.

  Posts involving American Politics, or contentious topics in American media, are permissible only on Thursdays (ET).

  Posts involving Personal Data are permissible only on Mondays (ET).
Please read through our FAQ if you are new to posting on DataIsBeautiful. Commenting Rules
Don't be intentionally rude, ever.

Comments should be constructive and related to the visual presented. Special attention is given to root-level comments.

Short comments and low effort replies are automatically removed.

Hate Speech and dogwhistling are not tolerated and will result in an immediate ban.

Personal attacks and rabble-rousing will be removed.

Moderators reserve discretion when issuing bans for inappropriate comments. Bans are also subject to you forfeiting all of your comments in this community.
Originally r/DataisBeautiful
Shoutout to the spike in women drinking when Trump got elected
Correlation is not causation, but...
The election was 15-16. Spike happened 14-15. Wondering if it was a methodology change to jump that much in 1 year?
Also fuck me but that was already 10 years ago. Was trying to recall if there was maybe some kind of viral social media thing that might have happened in 2014.
Gamergate
Robin Williams killed himself and Bill Cosby was arrested.
The text is to the left on '15; zoom in and compare the circles to the year. It was a 15-16 jump according to the dots.
The dot above 2014 isn't labeled. I'd guess it's about 31.7%. The dot above 2015 is 36.8%. That's far and away the largest year-over-year change and the jump I'm referring to.
2016 is the peak. But it's only barely slightly higher than 2015.
I think we're saying the same thing. I had understood your prior comment to mean that 2014 included 36.8%.
Was there one of the several "once in a lifetime" economic crashes that year? I can't remember, but that was my first thought.
Don't think so. By 14 we were pretty well out of the 08 mess. Was around when I got my first major career break. Which was nice as one of the millennials that finished college while the economy had gone to shit.
The advent of white claw