biscotty

joined 1 year ago
 

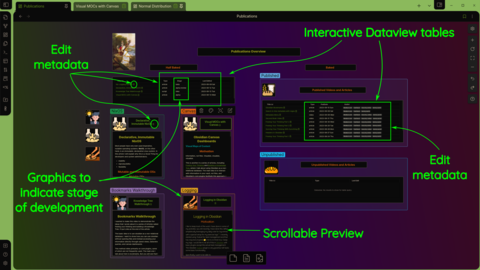
I recently published several articles here and elsewhere on using Obsidian’s native database functionality to increase focus and efficiency when working with the information in our vaults. Rather than using Obsidian as a souped-up word processor, we can abandon the file paradigm altogether and use Bookmark and Canvas for accessing, editing, analyzing and organizing our information.

Given the interest that the articles have generated, and the fact that the concepts may be unfamiliar to some, I thought it would be helpful to make a video demonstrating how it works in practice. It ended up being somewhat long, so this is the second part.

If you haven’t read the articles, this may be confusing as I don’t go into depth on the concepts. This isn’t really a how-to video, so it assumes you know your way around Obsidian.

The videos are available at:

My site:

biscotty's Workshop

Substack:

https://briancarey.substack.com/p/obsidian-nosql-workflow-part-1

https://briancarey.substack.com/p/obsidan-nosql-workflow-part-2

Medium:

https://medium.com/@biscotty666/obsidan-nosql-workflow-61b0d108df66


This is the last in a series of articles, including Freeing Your Thinking and Building a Knowledge Tree, where I talk about using Obsidian as a non-relational database. The main idea is to interact with information, not files, and Obsidian's core plugins facilitate this approach. I have talked about Search, Bookmarks, Unique Notes and Graph View. This article will describe how to use Canvas to create visual maps of content which not only present information in a clear, attractive and flexible way, but also allow you to explore and interact with your information. As usual, our goal is to obviate the need to open files.

In data science there is a motto "visualize, visualize, visualize." In the business world, information is commonly presented in the form of a dashboard to allow for visualizing data. A dashboard is a graphical user interface containing views of information. Aside from providing graphical elements and views, a dashboard will typically provide navigational tools and other ways to interact with information and even edit information directly from the dashboard.

The full article can be read at:

My site: biscotty's Workshop

Substack: https://briancarey.substack.com/p/dashboards-with-obsidian-canvas

Medium: https://medium.com/@biscotty666/dashboards-with-obsidian-canvas-2b86c024412e