this post was submitted on 11 Dec 2024
835 points (99.4% liked)
Science Memes
11414 readers
2116 users here now
Welcome to c/science_memes @ Mander.xyz!
A place for majestic STEMLORD peacocking, as well as memes about the realities of working in a lab.

Rules
- Don't throw mud. Behave like an intellectual and remember the human.
- Keep it rooted (on topic).
- No spam.
- Infographics welcome, get schooled.
This is a science community. We use the Dawkins definition of meme.
Research Committee
Other Mander Communities
Science and Research
Biology and Life Sciences
- !abiogenesis@mander.xyz
- !animal-behavior@mander.xyz
- !anthropology@mander.xyz
- !arachnology@mander.xyz
- !balconygardening@slrpnk.net
- !biodiversity@mander.xyz
- !biology@mander.xyz
- !biophysics@mander.xyz
- !botany@mander.xyz
- !ecology@mander.xyz
- !entomology@mander.xyz
- !fermentation@mander.xyz
- !herpetology@mander.xyz
- !houseplants@mander.xyz
- !medicine@mander.xyz
- !microscopy@mander.xyz
- !mycology@mander.xyz
- !nudibranchs@mander.xyz
- !nutrition@mander.xyz
- !palaeoecology@mander.xyz
- !palaeontology@mander.xyz
- !photosynthesis@mander.xyz
- !plantid@mander.xyz
- !plants@mander.xyz
- !reptiles and amphibians@mander.xyz
Physical Sciences
- !astronomy@mander.xyz
- !chemistry@mander.xyz
- !earthscience@mander.xyz
- !geography@mander.xyz
- !geospatial@mander.xyz
- !nuclear@mander.xyz
- !physics@mander.xyz
- !quantum-computing@mander.xyz
- !spectroscopy@mander.xyz
Humanities and Social Sciences
Practical and Applied Sciences
- !exercise-and sports-science@mander.xyz
- !gardening@mander.xyz
- !self sufficiency@mander.xyz
- !soilscience@slrpnk.net
- !terrariums@mander.xyz
- !timelapse@mander.xyz
Memes
Miscellaneous
founded 2 years ago
MODERATORS
you are viewing a single comment's thread
view the rest of the comments
view the rest of the comments

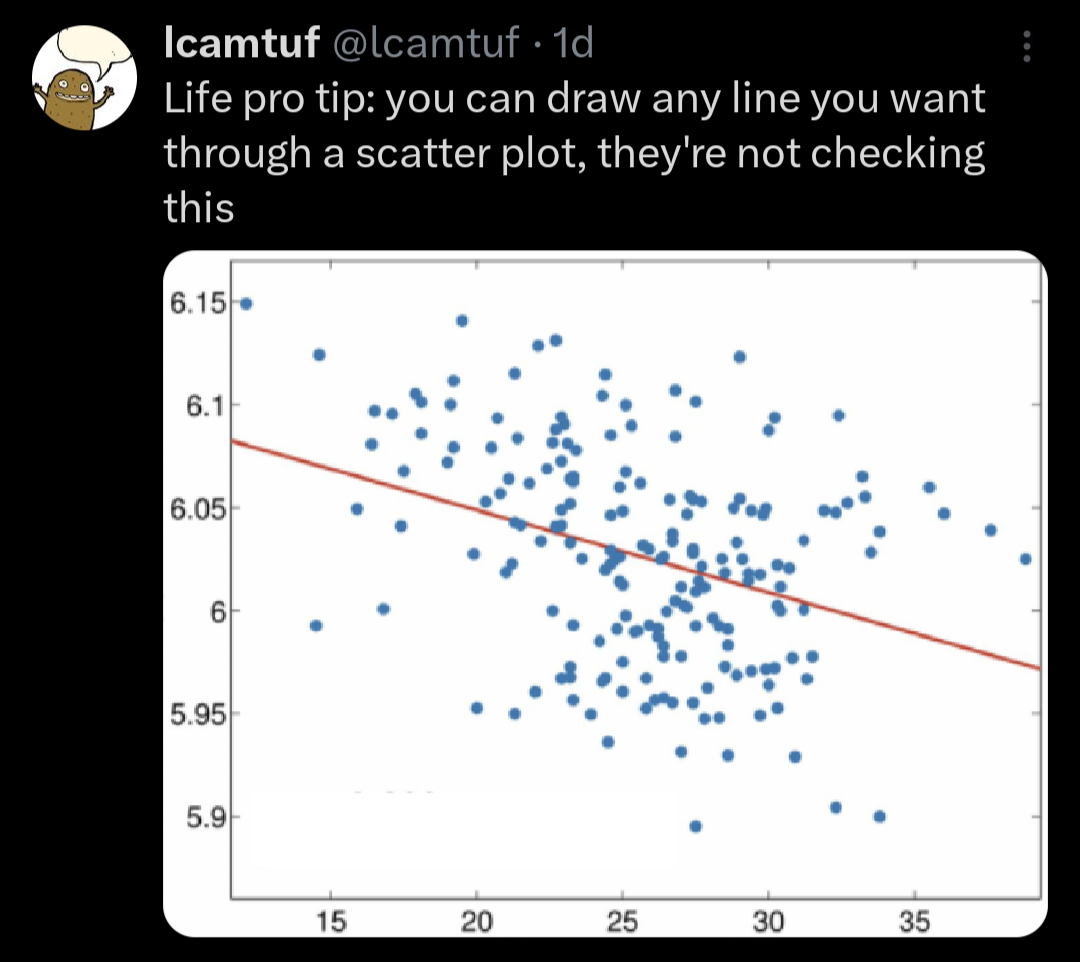
What's the r² on this, like ... 0.3 ish?
Less?
My guess is lower. I'd put the correlation at about -.35 to -.45, so that'd correspond to an R² of .1225 to .2025. But eyeballing correlations is hard.
Assuming it's a correction line, I don't think you can tell from the slope of that line alone as the clustering will matter and correlations are finicky. Now, if it was a regression coefficient, that sexy line can be calculated just by looking at it (although we'd want to know if it was significant, lol).
I was assuming its a simple linear regression fit, and attempting to eyeball the r², haha.