Hi all,
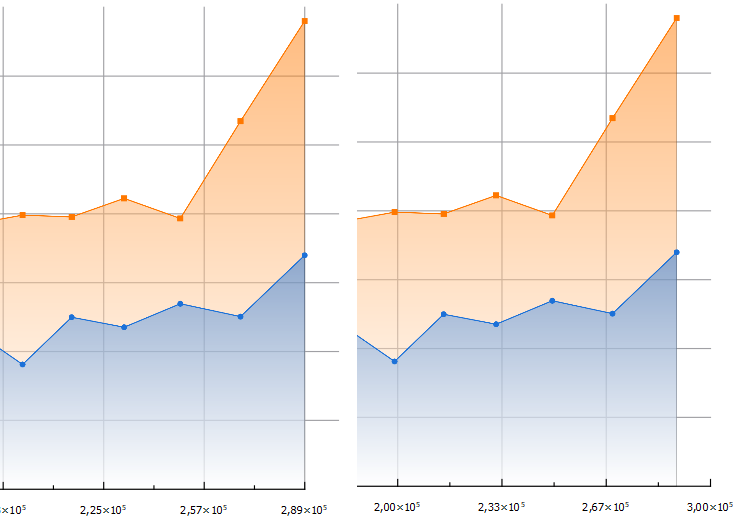
I just started using labplot. Mainly for visualization so far. I am currently plotting stuff in a line plot. For some reason I cannot figure out how to properly align my x-axis. If I reduce the data range my gridlines overextend. If I increase the x-axis range the axis just extends over my data.
Anyone know how to make this fit.
Sorry for the basic question but I have been banging my head against this for 2 days now and just can't figure it out.
If you have some good material beside the videos and documentation I am also happy to just take a link.
Thanks :)
edit: I use LabPlot 2.10.0 on Windows
For anyone wondering in this version.
You have to adjust your setting in the x-axis settings AS WELL AS the plot area settings.
This has been synchronized in 2.11.0
thanks to @LabPlot Maintainers for the quick help