Map Enthusiasts
3064 readers
19 users here now
For the map enthused!
Rules:
-
post relevant content: interesting, informative, and/or pretty maps
-
be nice
founded 1 year ago
MODERATORS
1
2
3
A selective superposition of important evolutions of Paris' city limits. Based on this animation video on the evolution of the limits of Paris, from Roman antiquity to present days.
Sources :
- Nicolas Delamare, Traité de la police, Paris, chez J.Cot, 1705 : “Second plan de la ville de Paris” ; “Troisième plan de la ville de Paris”, par Antoine Coquart
- Plan de Truschet et Hoyau, 1553
- Plan de Jean Delagrive, 1728
- Plan d’Alexis Donnet, 1837
- Satellite picture of Paris by Sentinel-2B, ESA, 2018
Most of them are available in very high quality on the David Rumsey cartography center.


10
215
The highest temperature forecast for the next 7 days (129.2° F/54.0° C is probably the highest reliably recorded temperature on Earth)
(arc-anglerfish-washpost-prod-washpost.s3.amazonaws.com)

11
12


15


18
216
Britain and Ireland if all polar ice on Earth melted (+ coastlines during last ice age)
(files.catbox.moe)


20

22
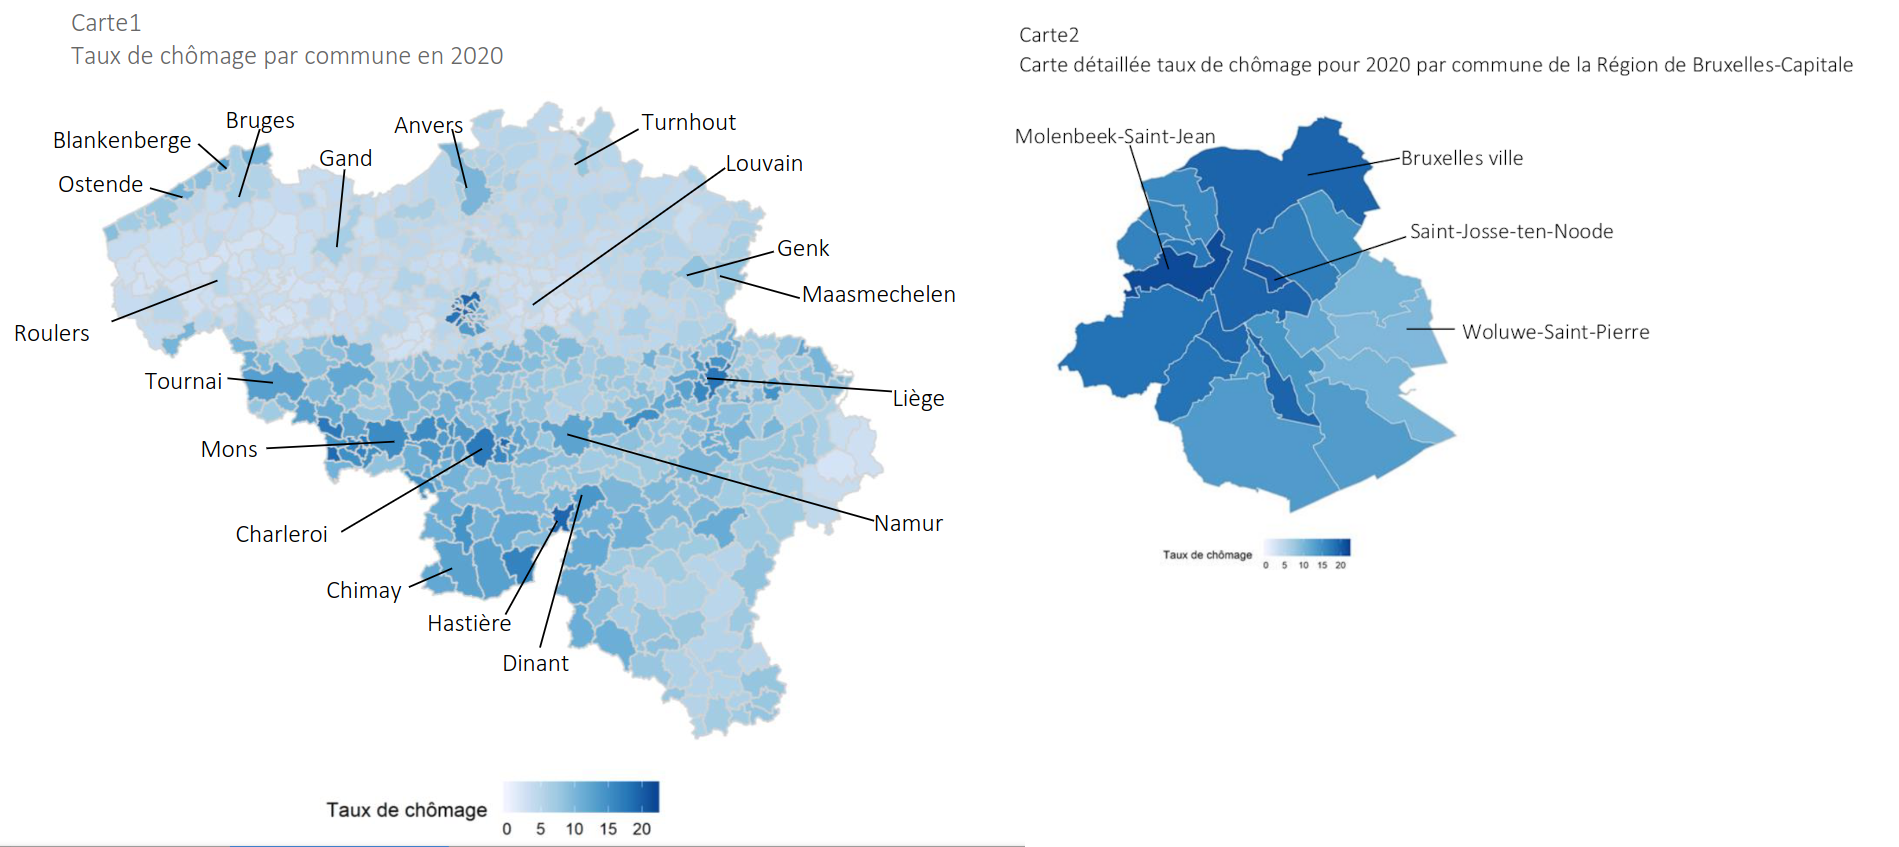
In the map it can be clearly seen that the unemployment is higher in Wallonia than in Flanders. This is largely due to the fact that Wallonia has historically relied on its heavy industry, such as steel and coal, which has moved abroad the last decades. In fact, the Sambre and Meuse valley which was the industrial heartland in Belgium thanks to its coal resources, can be clearly seen on the map.
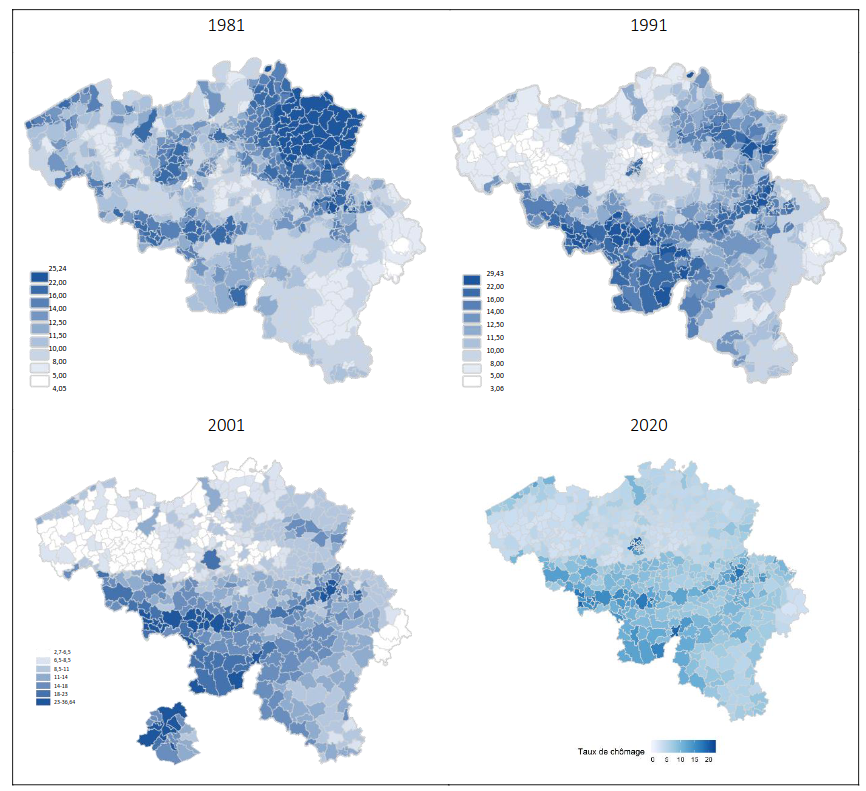
It is also interesting to see how the distribution of unemployment has changed throughout the years, as seen on these maps:
23


view more: next ›