this post was submitted on 23 Aug 2024
3 points (100.0% liked)
LabPlot Data Analysis and Visualization Software
112 readers
2 users here now
KDE's data visualization and analysis software. LabPlot is free, open source, works on Linux, WIndows and macOS, and is accessible to everyone.
Share here your tips, tricks and resources, request help, talk to the maintainers and devs, read LabPlot news, connect with other users.
founded 1 year ago
MODERATORS
you are viewing a single comment's thread
view the rest of the comments
view the rest of the comments

Hi,
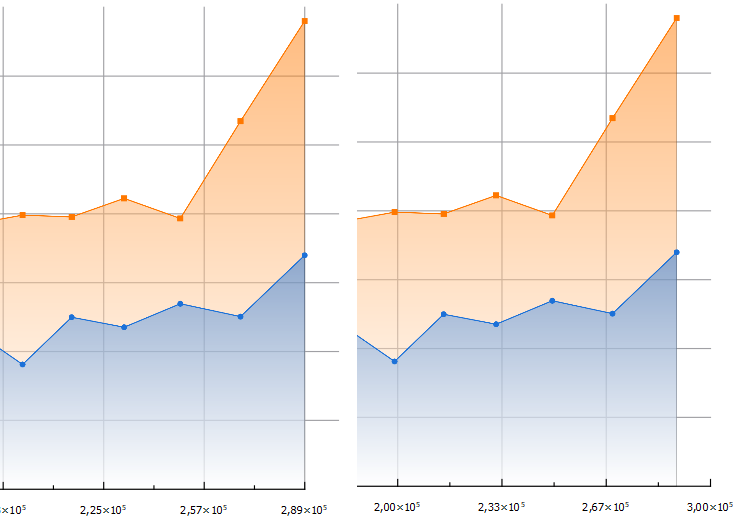
Could you switch to LabPlot 2.11.1? Plot ranges and axis ranges have been synchronized in 2.11 to make any adjustments more intuitive.
You can find it here: https://labplot.kde.org/download
Hi thanks this seems to be the case. The way it was before was pretty confusing for a first time user :D
Yes, the former solution offered more flexibility, but could be less intuitive at first :-)